Zabbix is great! Since I’ve worked with a lot of Monitoring systems (including HPOM, NNMi, Nagios, Zenoss and Cacti to name a few) Zabbix struck me with it’s Enterprise ready features. It totally fulfills all the needs my employer (and me) wants from a Monitoring system.
All needs??? Mmmm, almost all!
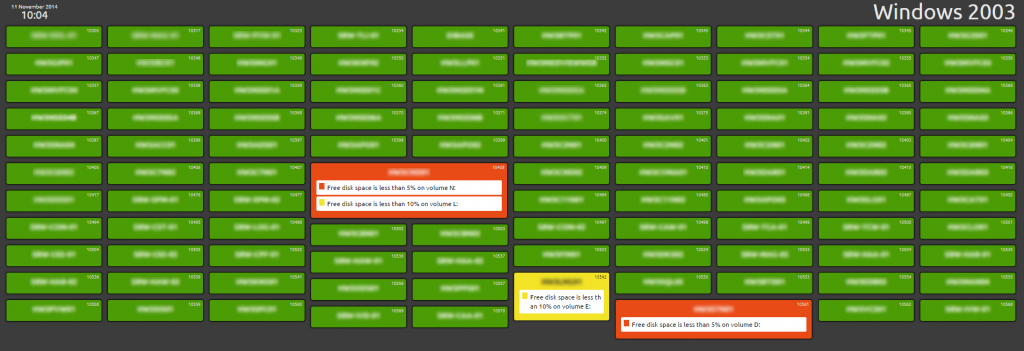
There is one feature I really miss in Zabbix and that’s a decent dashboard function. Yeah, the default dashboard (or screens / slideshows) are great but only for technicians. What I was looking for was a Dashboard that does explain things in a overview without being too technical.
Was I lost? Not really! In comes the Zabbix api!!
We have managed to create a dashboard function using the Zabbix api and php which creates a nice overview of things that are happening in our environment. Although I am not a programmer (I am more a front end developer) we’ve managed (thanks Don!) to create something nice (in my opinion)

What does it do I hear you asking?
Well, it does this and that, but let me summarize it:
- It’s build with php.
- It queries a Host Group (via a read only user access) and checks it’s active triggers
- If none of it’s trigger are fired, the host is probably ‘ok’ and will be shown in bright green on the dashboard
- If a trigger gets fired, the color and/or size are adjusted
- Using jquery and masonry javascripts hosts are aligned on the dashboard.
- And much more,…
Soon I will publish a second post which will be more “in detail”. Second, I’m going to post the files onto Github so everyone can use/adjust/fork the files.
Happy Zabbixing 🙂
hi, like your post and your dashboard, you already have the path of github? I want to implement in my work environment.
I’m grateful.
Luiz
Me too! Thanks a lot for your great Idea!
Hi,
your Dashboard looks very cool. I will test it.
When do you are ready for an download link?
I am hungry for this.
This dashboard looks awesome! Can’t wait to “use/adjust/fork the files” 🙂
Sorry for the delay. The download will be available in the first week of January on Github.
So from your initial image, I see you’re monitoring a Windows 2K3 group. Will this rotate through all enabled host groups?
@All
I have published the code on Github, link is included in this article:
http://all-about-incama.org/2014/12/29/building-a-better-dashboard-for-zabbix-now-on-github
@Bryce
Not yet as I wanted to keep it dead simple for people that have to work with these files. As a “not so nice” solution we use a browser tab switcher, which works fine for now.
Thank you very much for sharing your work!
Did you already thought about adding your project to?:
http://www.zabbix.com/third_party_tools.php
Introducing this in the Zabbix forums (https://www.zabbix.com/forum/) might be worth too!
@Marc
I first want to be certain the code works within different setups. Will publish it on the Zabbix forum when I’m confident enough 🙂
Thanks for the headsup 🙂
WOW!!! This is exactly what i was looking for!!!
Just don’t know how to get it to work .
You rock…this was a lifesaver. I decided to try and build my own dashboard, but stumbled upon yours in the process. With a few minor tweaks, I came up with a system that works great for us! We pass the groupid in the URL, and attach an image as well…
http://imgur.com/a/lXIPX
Thanks Dean! I hope the dashboard will fill your needs. Soon I will do some style reworks of the GUI, just to make it more future ready.
Please let me know how to install briefly
How to install? and display through URL